IELTS writing task 1 describing a pie chart

IELTS pie chart Question:
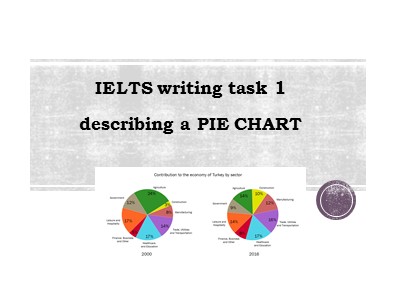
The two pie charts below show the percentages of industry sectors' contribution to the economy of Turkey in 2000 and 2016.
Summarize the information by selecting and reporting the main features and make comparisons where relevant.
Bạn đang xem tài liệu "IELTS writing task 1 describing a pie chart", để tải tài liệu gốc về máy bạn click vào nút DOWNLOAD ở trên
IELTS writing task 1describing a PIE CHARTIELTS pie chart Question:The two pie charts below show the percentages of industry sectors' contribution to the economy of Turkey in 2000 and 2016. Summarize the information by selecting and reporting the main features and make comparisons where relevant.1. IntroductionParaphrase the information from your question and mention 2 important things:what your graph showsfor what period of timeOverview briefly describe 2-4 key features of your chart.In our case there are two main options to describe key features:find the biggest and smallest slices of each pie chartfind which slices became bigger/smaller or didn't change Overall, at the beginning of the period construction contributed the least to the economy of Turkey and agriculture was the most significant economic sector. In comparison, at the end of the period healthcare and education became the largest economic segment and the lowest contribution was made by financial, business and other services.Bodyshould group the specific details of your chart in 2 paragraphs.You can group data in such way:Sectors that had an increase (construction; trade utilities & transportation; manufacturing; finance, business and other services)Sectors that had a decrease or didn't change (agriculture; government; leisure and hospitality; healthcare and education)Vocabulary for PIE CHART: biggest sliceIt is clear that ____represents the largest portion of _____, whereas _____ is undoubtedly the smallest.Sales of _____ stood at __% in 1925, which is the majority of_____.(If the percentage is around 60%) – Nearly a third (If the percentage is around 52%) – Over a half of all respondents smallest sliceA small fraction Exactly 30% of students (If the percentage is around 25%) Roughly a quarter of respondents whereas sales for _____ were just 10%.In 1955 approximately three quarters were ____, whereas in 1960 this had fallen to just under a fifth.FractionWritten formPercentageFractiona half50%1/2a third33%1/3two thirds66%2/3three quarters75%3/4a quarter25%1/4
Tài liệu đính kèm:
 ielts_writing_task_1_describing_a_pie_chart.pptx


